Increasing self-production of electricity at home has a couple of benefits.
- Enhancing decarboniztion (only 29% of electricity from grid was produced from renewable power sources (PGE, 2019)).
- Increasing independency of power production.
My first solar system produced 3803 kWh per year (an average of 2015 - 2020) 1. Switching a gas-powered car to an electric car in 2019 increased electricity comsumption 2.5 times (from (3938 to 10342 kWh). The last year (2020) I started second solar system project for my house to increase production of electricity at home. I will describe detailed electricity data analysis on my house after expanding solar system later post. In this post, I will summarized timelines of the secondsolar system installation, which took time than I expected possibly due to series of avoidable mistakes. In view of data analysis,Gannt chart is useful visualization tool of timeline. lubridate R package is used for handling date data and lares R packages is used for making Gannt chart.
devtools::install_github("laresbernardo/lares")library(tidyverse);library(lubridate);library(lares)## ── Attaching packages ─────────────────────────────────────── tidyverse 1.3.0 ──## ✓ ggplot2 3.3.3 ✓ purrr 0.3.4
## ✓ tibble 3.0.4 ✓ dplyr 1.0.2
## ✓ tidyr 1.1.2 ✓ stringr 1.4.0
## ✓ readr 1.4.0 ✓ forcats 0.5.0## ── Conflicts ────────────────────────────────────────── tidyverse_conflicts() ──
## x dplyr::filter() masks stats::filter()
## x dplyr::lag() masks stats::lag()##
## Attaching package: 'lubridate'## The following objects are masked from 'package:base':
##
## date, intersect, setdiff, union# since today() is ymd, use ymd for all
today <- as.character(today())
#
solar.inst <- tribble(~type,~event,~start,~end,
"CA’s county\n risk levels\n in my County","purple","2020-11-17", "2021-02-23",
"CA’s county\n risk levels\n in my County","red","2021-02-23","2021-03-23",
"CA’s county\n risk levels\n in my County","orange", "2021-03-23",today,
"solar system","reviewing & signing DocSign","2020-11-03","2020-11-07",
"solar system","design approval","2020-11-19","2020-11-20",
"solar system","contact from designer","2020-11-17","2020-11-18",
"solar system","installation (1st attempt) [^2]","2020-11-28","2020-11-29",
"solar system","installation (2nd attempt)","2020-12-18","2020-12-19",
"solar system","1st payment, $6912", "2020-12-21","2020-12-22",
"solar system","city inspection (1st)","2021-01-20","2021-01-21",
"solar system","city inspection (2nd)","2021-02-05","2021-02-06",
"solar system","2nd payment, $1728","2021-02-09","2021-02-10",
"solar system","Application of PGE permission by Ilum solar","2021-02-11","2021-02-12",
"solar system","Approval by PGE","2021-02-24","2021-02-25",
"solar system","Obtaining info for access to solarEdge inverter from mySolarEdge app.","2021-02-25","2021-02-26",
"solar system","Ilumn solar technitian visit [^3]","2021-03-02","2021-03-03",
"solar system","Ilumn solar technitian visit [^4]","2021-03-09","2021-03-10",
"solar system","Ilumn solar technitian visit [^5]","2021-03-11","2021-03-12",
"solar system","Ilumn solar technitian visit [^6]","2021-03-16","2021-03-17",
"solar system","confirmation of electricity production [^7]","2021-03-16","2021-03-20")
# format date as Date
solar.inst <- solar.inst %>% mutate(start2 = ymd(start),end2=ymd(end))
# sort by start2 date
solar.inst <- solar.inst %>% arrange(start2)
#
p <- plot_timeline(event = solar.inst$event,
start = solar.inst$start2,
end = solar.inst$end2,
title = "Timeline of our 2nd solar system installation",
subtitle = "",
# Simple trick to re-arrange the grids
group = factor(solar.inst$type, levels = c("CA’s county\n risk levels\n in my County", "solar system")))
# plot
p + theme(axis.text.x=element_text(angle=90))## Warning: Removed 40 rows containing missing values (geom_label).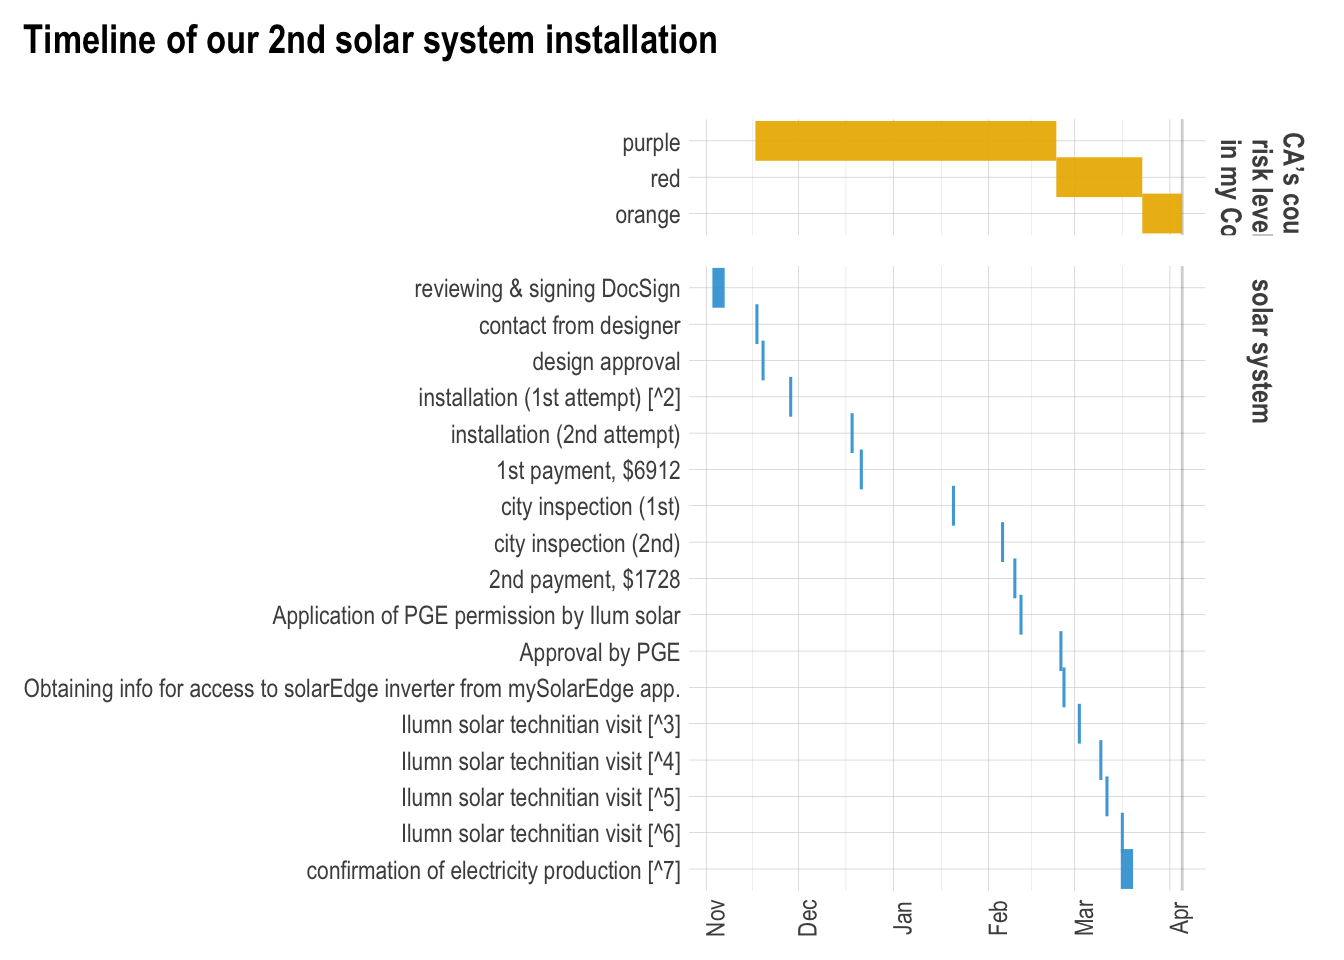
SolarEdge inverter notes
- Learning SolarEdge system (HD-wave)
- Only SolarEdge SetApp-enabled inverters (without a LCD display) can be activated or configured via SetApp.
- How to communicate an inverter to SolarEdge server (“monitoring communication”)? See 2:50 in a Youtube video
- Reading LED lights signals on the inverter. See https://www.solaredge.com/us/leds
- Stuck night mode.
California’s county risk levels California Solar Consumer Protection Guide
Inline R code was used,
`r round(mean(c(3803.7,3733.2,3724.5,3849.9,3780.9,3923.0)),digits=0)`(see T. Hovorka, 2017)↩Failed due to miscommunication. An installer came to my house while I was out of town.↩
Unable to communicate with the inverter from my SolarEdge App. I called SolarEdge support center, said there is no communication set up, which needs an installer.↩
It turned out that the inverter needs a new cellular plug-in becasue of a barcode for cellular plug-in was needed to proceed commision process. WiFi communication with my home WiFi for monitoring did not work (I assume that the inverter needs antenna for WiFi (there is no WiFi antenna on the inverter at present).↩
Replacing cellular plug-in module. However, there is no electricity production (checked PGE energy use. Also no production in SolarEdge monitoring). SolarEdge support told me that the inverter was on stuck night mode and suggest that I needed to ask an instalelr for following troubleshooting protocol of stuck night mode.↩
Following troubleshooting protocol (no problems). Restarting system worked. I assume that turning on DC switch during comission was wrong procedure. DC switch should have been on the first step (I guess).↩
See following blog.↩