reading packages
library(tidyverse)
library(lubridate)
library(scales)
Buring gas produce CO2. Reducing gas usage is critical to reduce CO2 production from our house. Here is the history of our gas usage of my house since 2012 November.
# reading data
gasdata <- read.csv(file.path("/Volumes","data_personal","Kazu_blog","resources","pge_gas_billing_data_8882170746_2012-11-14_to_2020-10-09.csv"),skip=5)
# data format
summary(gasdata)
## TYPE START.DATE END.DATE USAGE UNITS
## Natural gas billing:95 1/10/13: 1 1/8/17 : 1 Min. : 2.00 therms:95
## 1/10/14: 1 1/8/18 : 1 1st Qu.:11.00
## 1/10/15: 1 1/9/13 : 1 Median :15.00
## 1/10/16: 1 1/9/14 : 1 Mean :24.96
## 1/10/19: 1 1/9/15 : 1 3rd Qu.:39.50
## 1/10/20: 1 1/9/16 : 1 Max. :90.00
## (Other):89 (Other):89
## COST NOTES
## $15.42 : 2 Mode:logical
## $9.78 : 2 NA's:95
## $10.81 : 1
## $10.83 : 1
## $101.56 : 1
## $102.84 : 1
## (Other) :87# format data
gasdata2 <- gasdata %>% mutate(COST2 = str_remove_all(as.character(COST),"\\$") %>% as.numeric())
gasdata2 <- gasdata2 %>% mutate(
START.DATE2 = mdy(START.DATE),
date = date(START.DATE2),
year = year(START.DATE2),
month = month(START.DATE2) %>% factor(levels=1:12),
day = day(START.DATE2),
yday = yday(START.DATE2),
wday = wday(START.DATE2))
str(gasdata2)## 'data.frame': 95 obs. of 15 variables:
## $ TYPE : Factor w/ 1 level "Natural gas billing": 1 1 1 1 1 1 1 1 1 1 ...
## $ START.DATE : Factor w/ 95 levels "1/10/13","1/10/14",..: 18 24 1 37 44 49 57 67 75 80 ...
## $ END.DATE : Factor w/ 95 levels "1/8/17","1/8/18",..: 24 3 36 43 48 56 65 74 86 88 ...
## $ USAGE : int 30 90 70 49 19 18 14 11 9 11 ...
## $ UNITS : Factor w/ 1 level "therms": 1 1 1 1 1 1 1 1 1 1 ...
## $ COST : Factor w/ 93 levels "$10.81 ","$10.83 ",..: 52 3 83 68 39 42 26 10 89 7 ...
## $ NOTES : logi NA NA NA NA NA NA ...
## $ COST2 : num 32.1 101.6 73.5 50 20 ...
## $ START.DATE2: Date, format: "2012-11-14" "2012-12-11" ...
## $ date : Date, format: "2012-11-14" "2012-12-11" ...
## $ year : num 2012 2012 2013 2013 2013 ...
## $ month : Factor w/ 12 levels "1","2","3","4",..: 11 12 1 2 3 4 5 6 7 8 ...
## $ day : int 14 11 10 9 13 11 11 12 12 10 ...
## $ yday : num 319 346 10 40 72 101 131 163 193 222 ...
## $ wday : num 4 3 5 7 4 5 7 4 6 7 ...plot
gasdata2 %>% ggplot(aes(x=month, y=year,  fill=USAGE)) +
    geom_tile(col = 'grey40') +
    scale_fill_continuous(labels = scales::comma, low = 'grey95', high = '#008FD5') +
    theme(panel.grid.major = element_blank(),axis.text.x=element_text(angle=90)) +
    scale_y_reverse() +
  geom_text(aes(label=COST2 %>% round() %>% str_c("$",.))) +
    labs(title = "Fig. 1. Monthly gas usage and cost",x="Month",y="Year")  +
coord_equal() 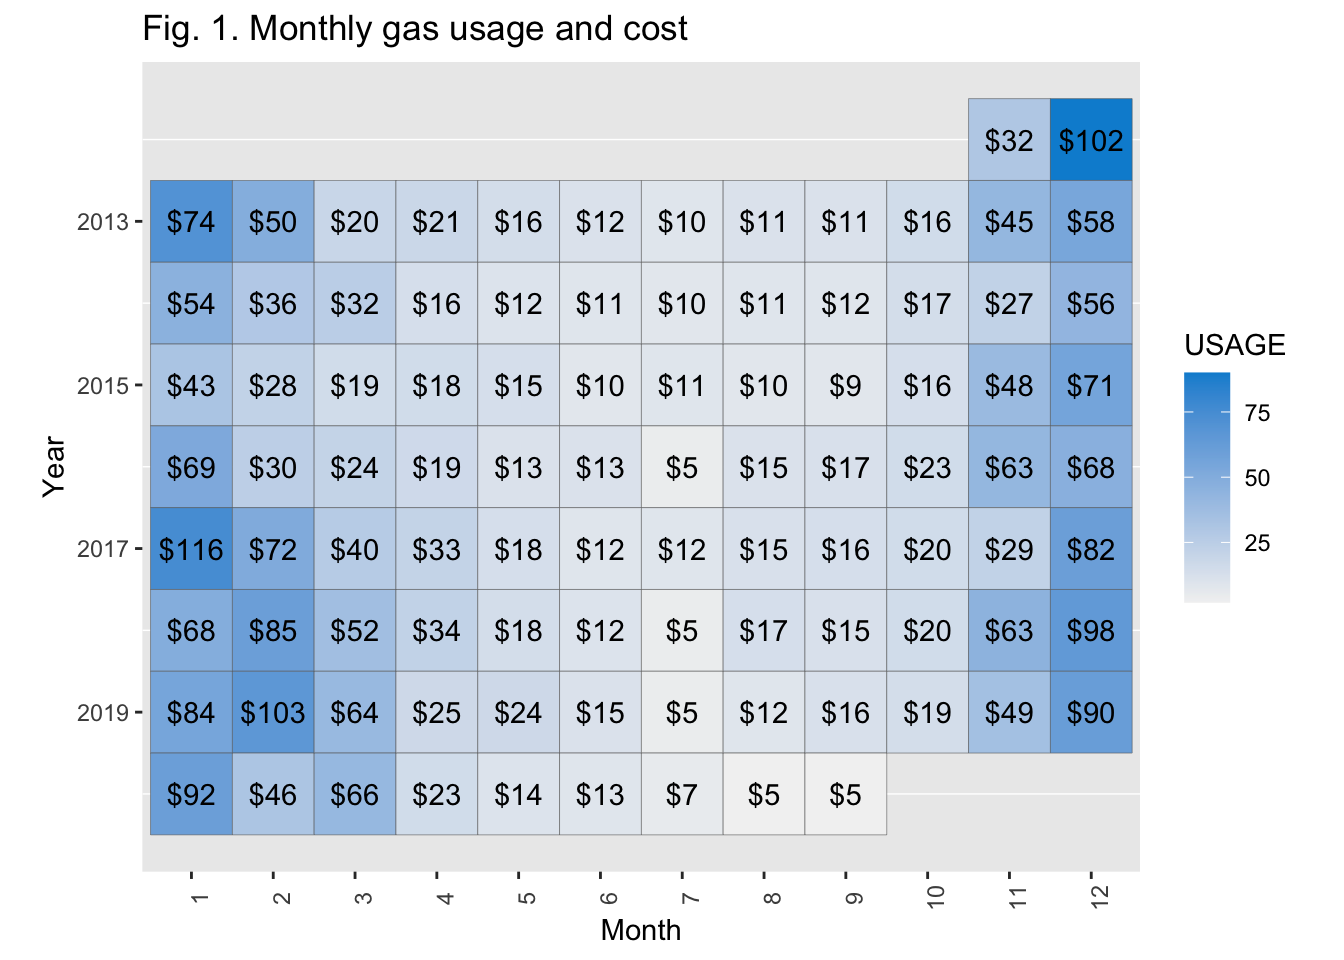
Yearly gas comsumption had a big peak in winter season probably because gas water heater and gas-powered furnace are used extensively during winter. Other gas-powered equiptments are kitchen cooktop and an oven.
As a next decarbonization project, we replaced old gas water heater to a heat pump water heater (HPWH) because HPWH is 5x more efficient than gas-powered one read an article in Cleantechnica.com. Moreover, since HPWH is an electric device like a reverse system of a refrigerator, lowering CO2 amount in generating electricity by increasing ratio of clean energy should save more CO2 production.
Needs to custamize heating schedule
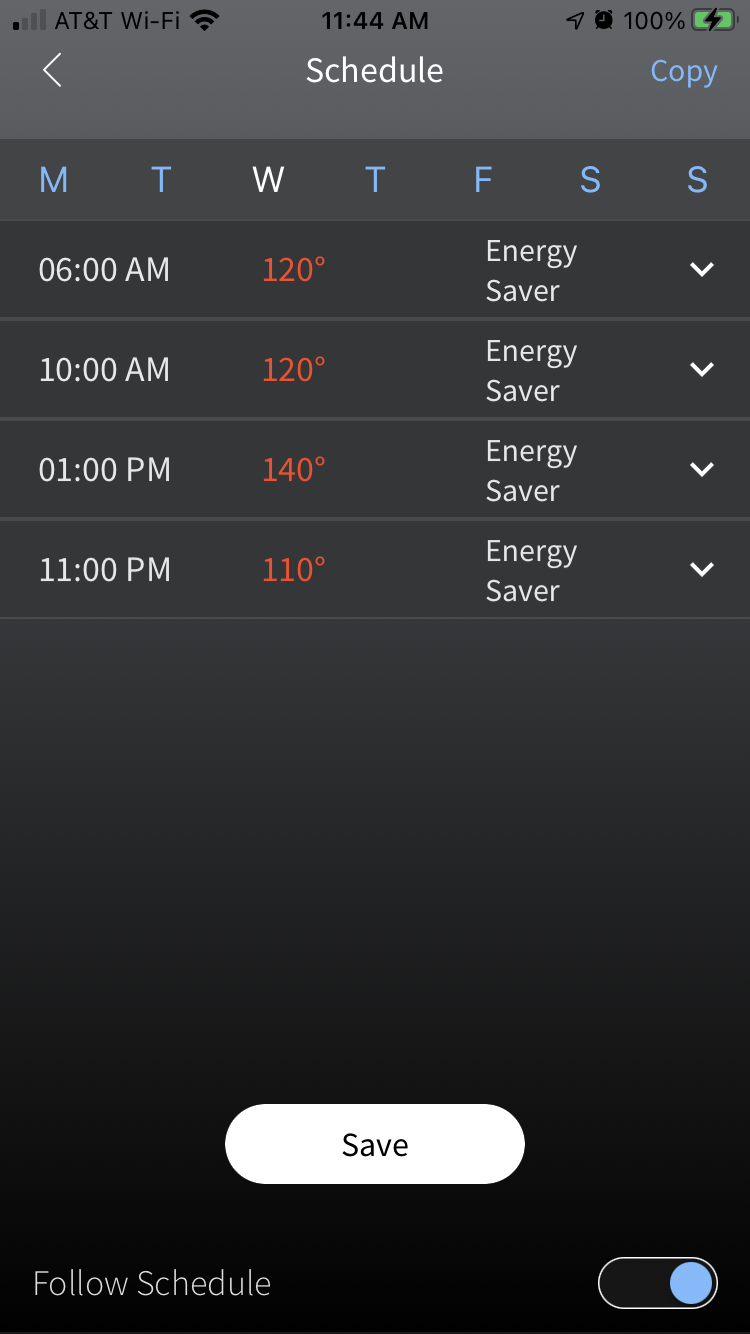
Fig.2 EcoNet_schedule1
Our new HPWH has an app to control weekly heating schedules. At the late November, I noticed that we do not have enough hot water when we filled hot bath and used hot water for hand dish washing at evening probably because water temparature was getting lower at the beginning of winter. After several attempls of adjusting the schedules, I came up with a schedule that has higher water temparature only during evening. Since our electricity price is higher during peak period (4pm - 9 pm) due to time-of-use (TOU) plan and it takes time to heat water by energy efficienty compressor than energy inefficient electric element, heating has to start from 1 pm and temparature has to set to lowest when hot water is not needed (11 pm) (Fig. 2).
Saving California power outage during peak time by switching to heat pump water heater
Another benefit to avoid heating during peak time is to save California power outage due to overuse of electricity during peak time during extream heatwaves that happened the last summer read a Cleantechnica.com article. An important point is that HPWH cools down around its place (remember that HPWH is reverse system of a refrigerator). In my house, our HPWH is placed inside a garage, where was cooler after installing HPWH on August.