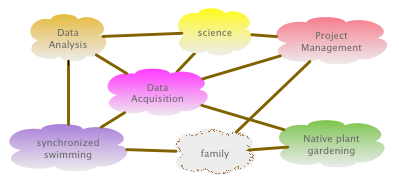
Here I would like to start describe briefly how I manage my work and personal projects.
How to make your experiments reproducible
As scientists we need to convince others that your results are not by chance. Here are four advices I want to emphasize here.
- Keep all records on your lab notebook presicely that should be easy to understand.
- Simplify methods of data input to reduce errors.
- Have clear and precise data analysis.
- Efficiently manage time and resources to conduct experiments (or works in general).
Keep records in your lab notebooks presicely that should be easy to understand
You data and lab notebooks have to be well organized for others and yourself to make everything you’ve done transparent. To facilitate communication between your boss, your collaborators, and you, I use online notebook systems such as Evernote, Google Drive including Docs and Sheets, and benchling.com for molecular biology work. Please find other excellent websites for leaning how to keep records daily.
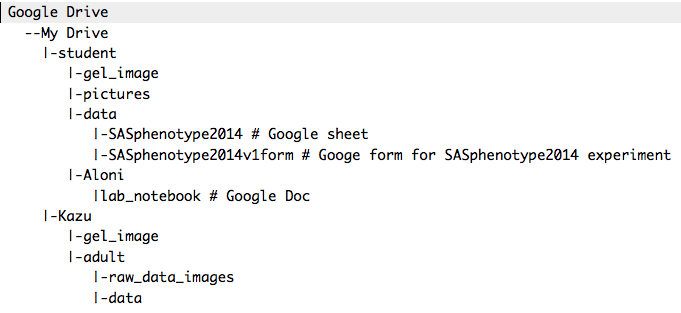
 Fig. 1. An example of Google Drive directory structure for sharing data and lab notebook with students (“Aloni” in this example).1
Organized directory is essential for proper data storage (Fig. 1).
Simplify methods of data input to reduce errors
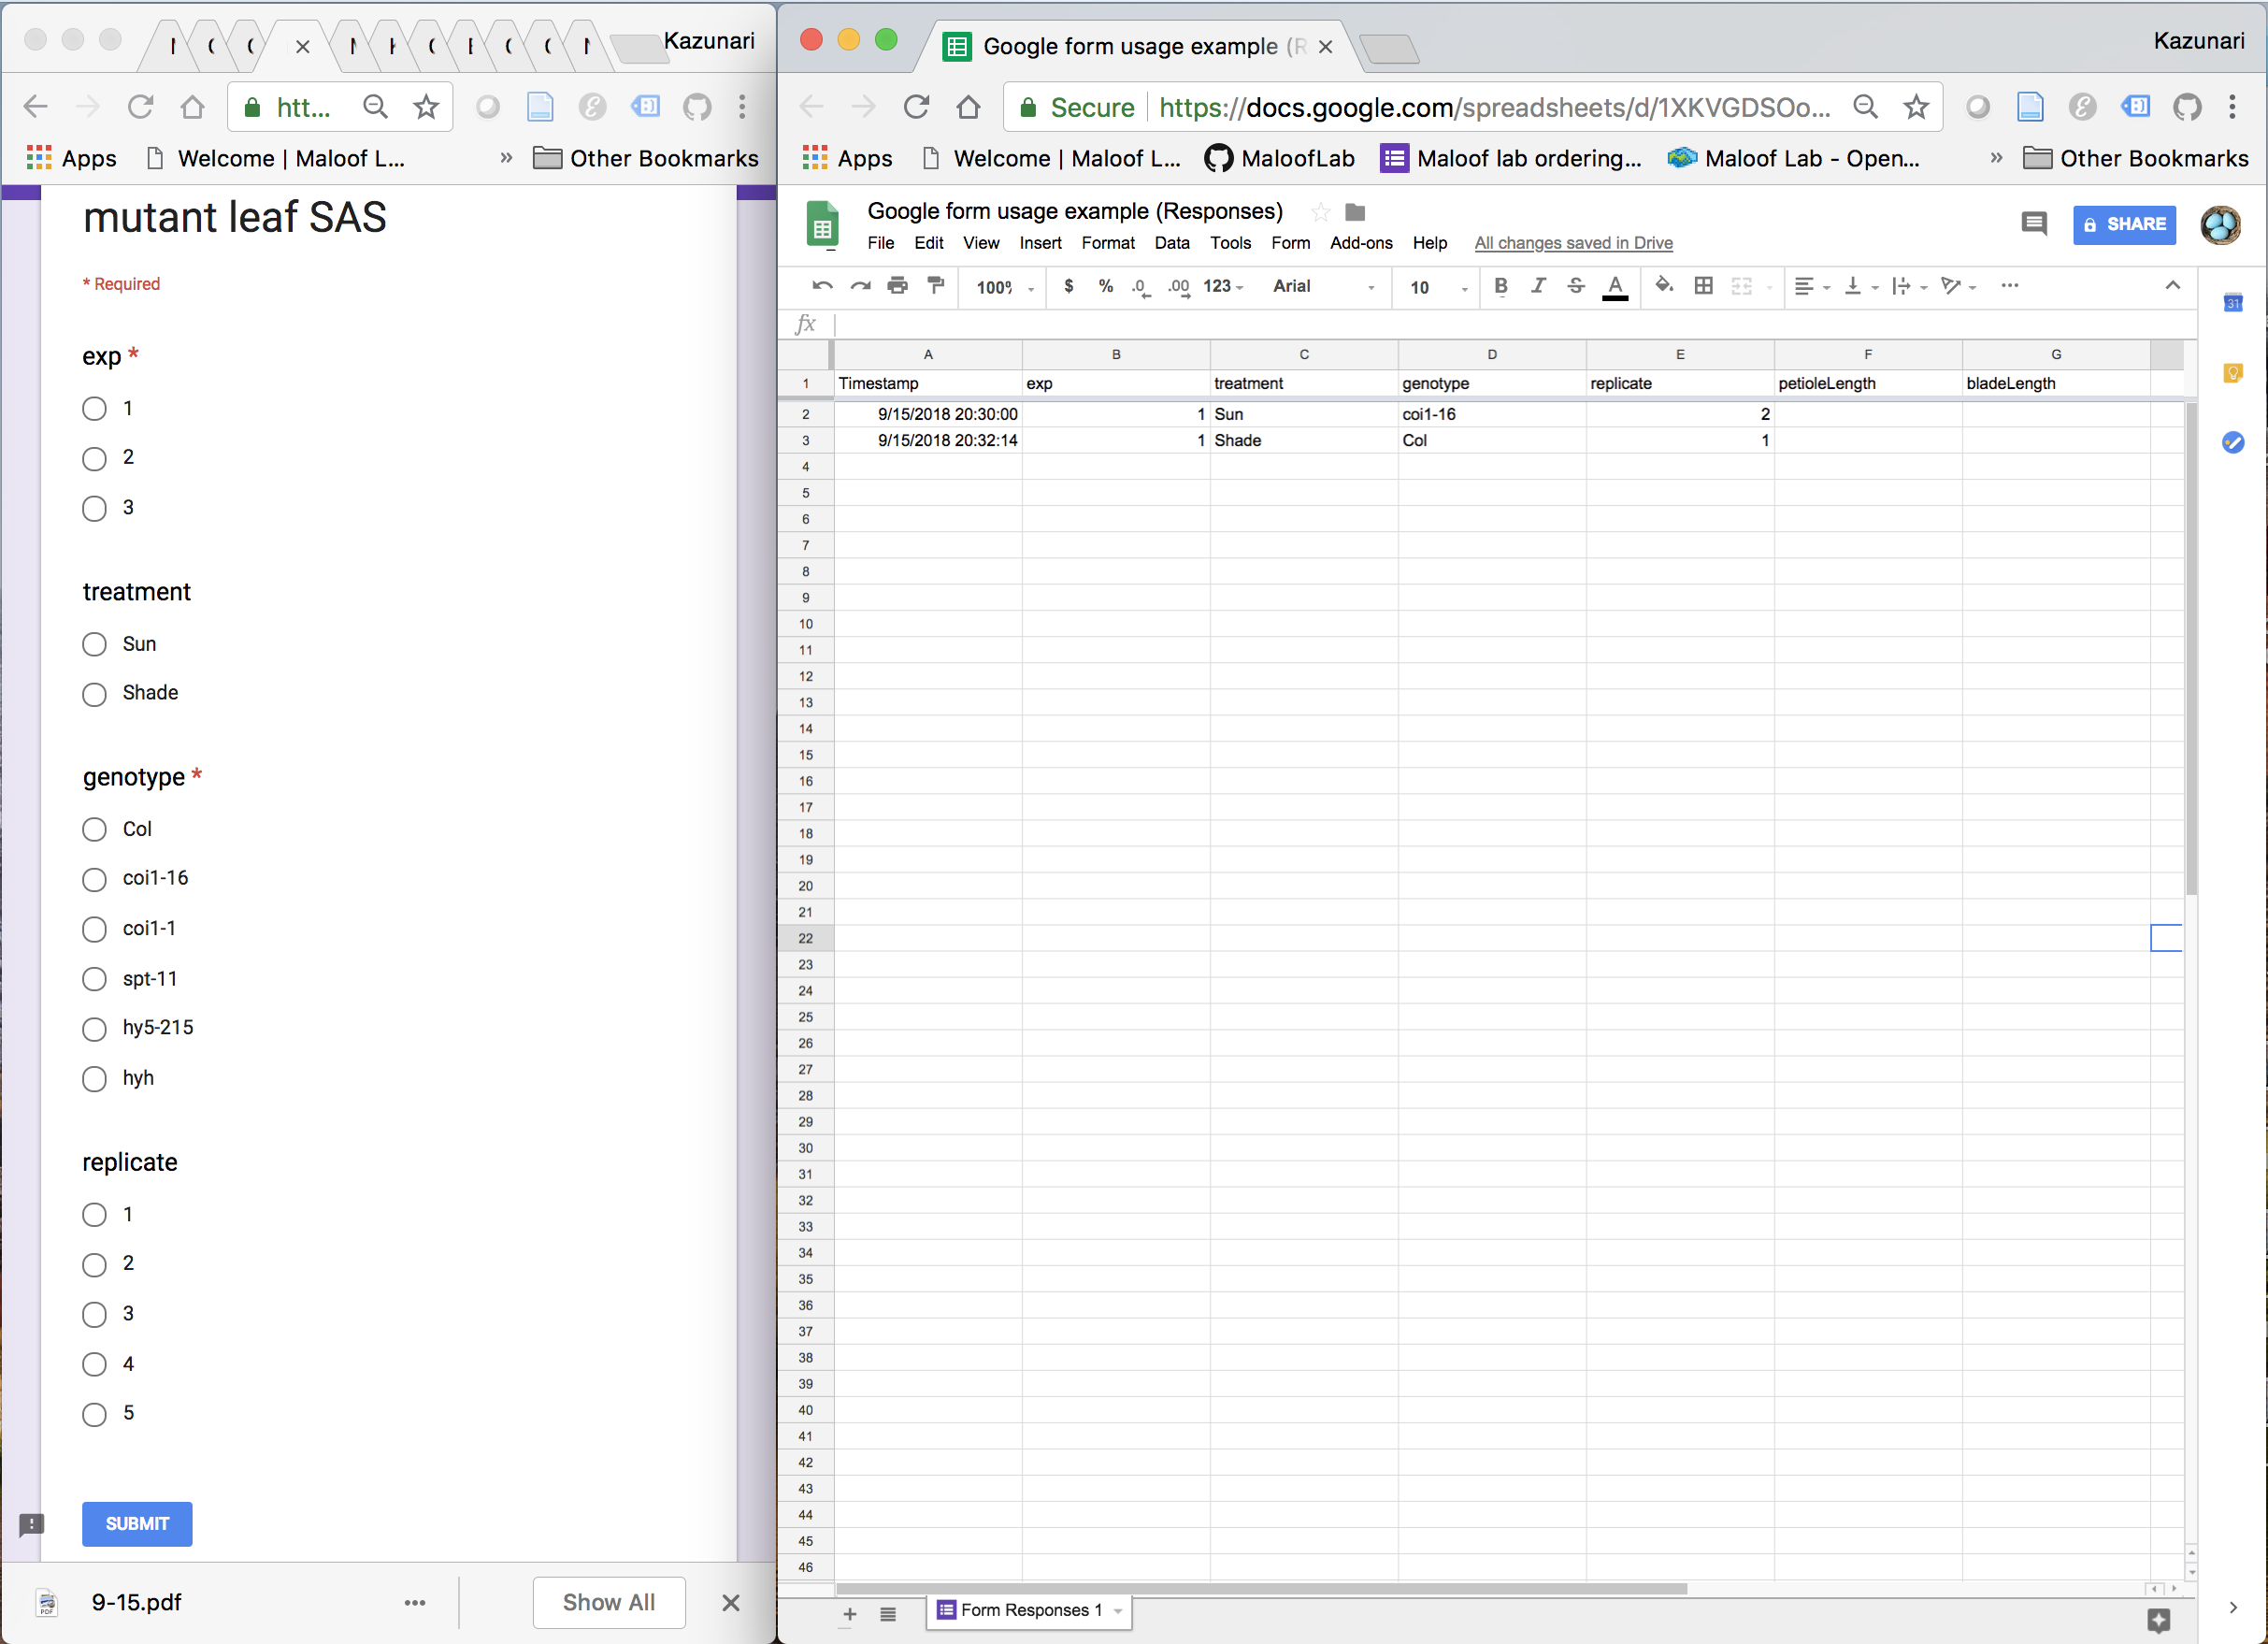
 Fig. 2. An example of usage of Google Form for data input.
When you handle a lot of samples, you will have errors in data input. For example, “Col”, “coi1-16”, “coi1-1” are easy to be confused even if you wrote those labels by yourself. To prevent such a incident is to use Google Form, which has a list of sample names that you only can choose them (Fig. 2). Another method is to use barcodes, which can be printed out onto stickers by using word processors. We used to use USB-wired barcode reader that connects to a computer, which enable to input decoded info from barcodes to Excel sheets. In the era of smartphone (as of 2018), I updated the barcode system which uses Google Sheet and a smartphone. Please read “How to make QR code in Google Sheet using Integromat.com.” and “How to read QR code and transfer data to Google sheet”.
Have clear and precise data analysis.
R/bioconductor + RStudio + Github + Shiny app (if necessary to share).
I highly recommend that you use statistic environment, R, and bioconductor package (for bioinformtics), in RStudio interface. Combined with Github or other web-based version control, you can keep track your data analysis. If you are interested in whole series of training of their application, please visit Prof. Julin Maloof’s lab class in University of California, Davis. Shiny is an R package for making web application, and some of our efforts are found in Julin Maloof lab website. I will touch this topic more details in the future posts.
Effectively manage time and resources to conduct experiments (or works in general)
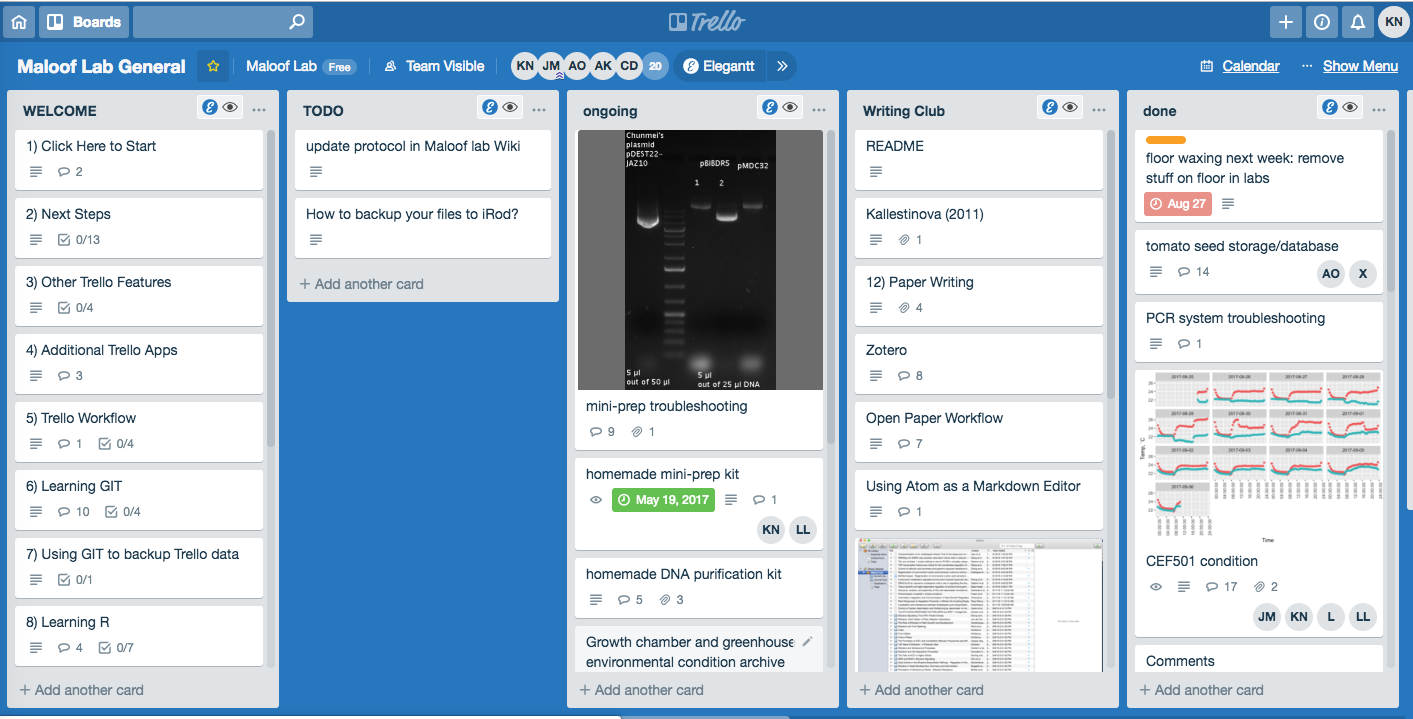
 Fig. 3. An example of usage of Trello in Maloof lab, University of California Davis.
Trello[see Fig.3], Reminder (Apple only?), Evernote, benchling.com, and Gantt Chart (OmniPlan (this is paid software), or Elegantt with Trello) are software I used for time and resource (labor, materials, etc) management. I am planning to explain more details in the future.
Easy accessible lab database
In addition to lab member’s efforts, a lab needs to provide organized lab database, including inventory (plasmid DNA, glycerol stock, seeds, hopefully reagents, using Google Sheets) and protocols (lab website or benchling.com).
More information
More info found in “The “Gold Standard” of Data Science Project Management October 6, 2018 By Matt.0”.
Enjoy your work.
If you are interested in more details, please keep your eyes on this blog. I am planning to update soon. Thank you very much!
- Having READme file in this directory top is recommended. ↩